Learn how SAM4 uses electrical data to determine and display where a pump is operating in real time with respect to its pump curve and best efficiency point. This insight is coupled with automated advice on how to achieve efficiency and pinpoint developing failures. Once implemented, it leads to reduced downtime, extended machine life and lowered costs.
Pump curve essentials
Pumps are a focal point of operations in different industries and pump curves are essential in choosing the appropriate pump for the required application. They are vital in determining how efficiently pumps are performing, helping to troubleshoot potential damage and helping to optimize performance and energy consumption. Calculating where a pump is actually operating against its pump curve i.e. how close to its best efficiency point (BEP) incurs avoidable operational costs.

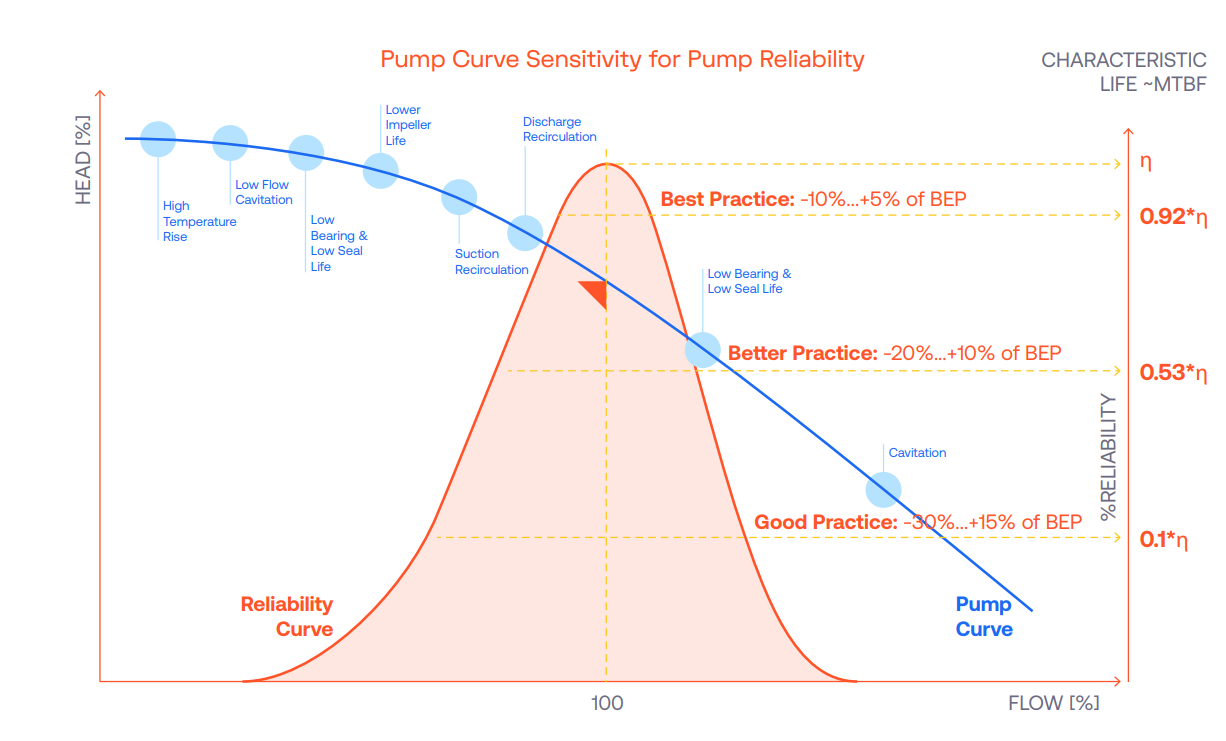
Source: Judy Hodgson (Du Pont): “Predicting Maintenance Costs Accurately,” Pumps & Systems, April 2004
The impact of operating away from the best efficiency point
Depending on the industry, many factors can influence why pumps operate away from their best efficiency point. The equipment may not be set up optimally or be over-sized for the operating requirements; there could be developing failures; and different types of blockages could be present.
A pump’s should operate in its best efficiency point for optimal reliability and efficiency. However, in practice there are a variety of reasons why this is not always the case. There may be design reasons; e.g., safety factors by the process engineer, mechanical engineer and pump manufacturer all stack up, resulting in an oversized pump. A pump station may even be oversized on purpose, to be able to deal with the forecasted population growth for the next 20 – 30 years. On the other hand, operational issues may cause operation far away from BEP; wear and tear, blockages or (partially) closed valves, or even sub-optimal control logic. Operating away from BEP could also simply be due to regular variations in operational demand. Whatever the reason, the further a pump operates away from BEP the more detrimental it is.
Energy waste also increases the further away from BEP a pump operates, which increases operating costs. From an asset health perspective, it can lead to cavitation and fluid turbulence causing pump seals, shafts, bearings and impellers to wear out quickly. Very low flow rates can also cause rapid temperature increases inside the pump which can lead to complete pump failure or even pump destruction.
This all leads to lost production and increased maintenance costs. It also reduces equipment lifetime, leading to increased capital costs. With this in mind, it is advantageous to detect any such issues as quickly as possible to reduce the risk of failures and optimize energy consumption.
Pump visits vs. SAM4 real-time pump performance curve
The standard practice for estimating how efficiently pumps are performing requires visiting pump locations. Pressure and flow measurements are performed at the inlet and discharge sides of each pump, and data is compared against a manufacturer’s pump curve. These physical pump tests are often only performed once every 5 to 10 years, and provide an indication of static pump efficiency, but don’t provide insight into day-to-day flows and losses.
However, if a potential issue is suspected, further diagnostic tools would be necessary to provide any real insight into what the root cause of this may be. This process can be time consuming and incurs associated financial and environmental costs i.e. emissions related to transport, especially if the pumps are operating in a challenging environment..
Samotics’ SAM4 solution incorporates an automatically generated pump curve feature which avoids the need to physically visit pump locations. It calculates continuous and accurate estimates of pressure and flow measurements from electrical data and plots these against either the pump curve from the pump manufacturer or a more recent pump test curve, if available. This provides the comparative baseline for analytics purposes.
It is visually displayed in Samotics’ real-time pump curve and pump performance dashboard. The dashboard provides a real-time and historical view of where a pump is operating with relation to its BEP (Figure 2). Based on reliability theory, it clearly shows to what degree pump operations fall within the best practice area (green), inefficient area (yellow) or bad practice area (red).

Additional features within SAM4 and its pump performance suite determine if and what additional actions need to be performed to improve how efficiently the pump is operating.
Monitoring continuously has the major advantage of being able to detect signs of operational inefficiency/suboptimal behavior much quicker. This can assist in changing operational settings to have pumps operating closer to BEP and helping to reduce energy consumption and costs in a shorter time frame. Continuous monitoring further allows any operational improvements to be tracked to confirm whether they persist and more importantly to identify when the situation starts to decline again. This would not be possible through five- to ten-yearly pump testing.
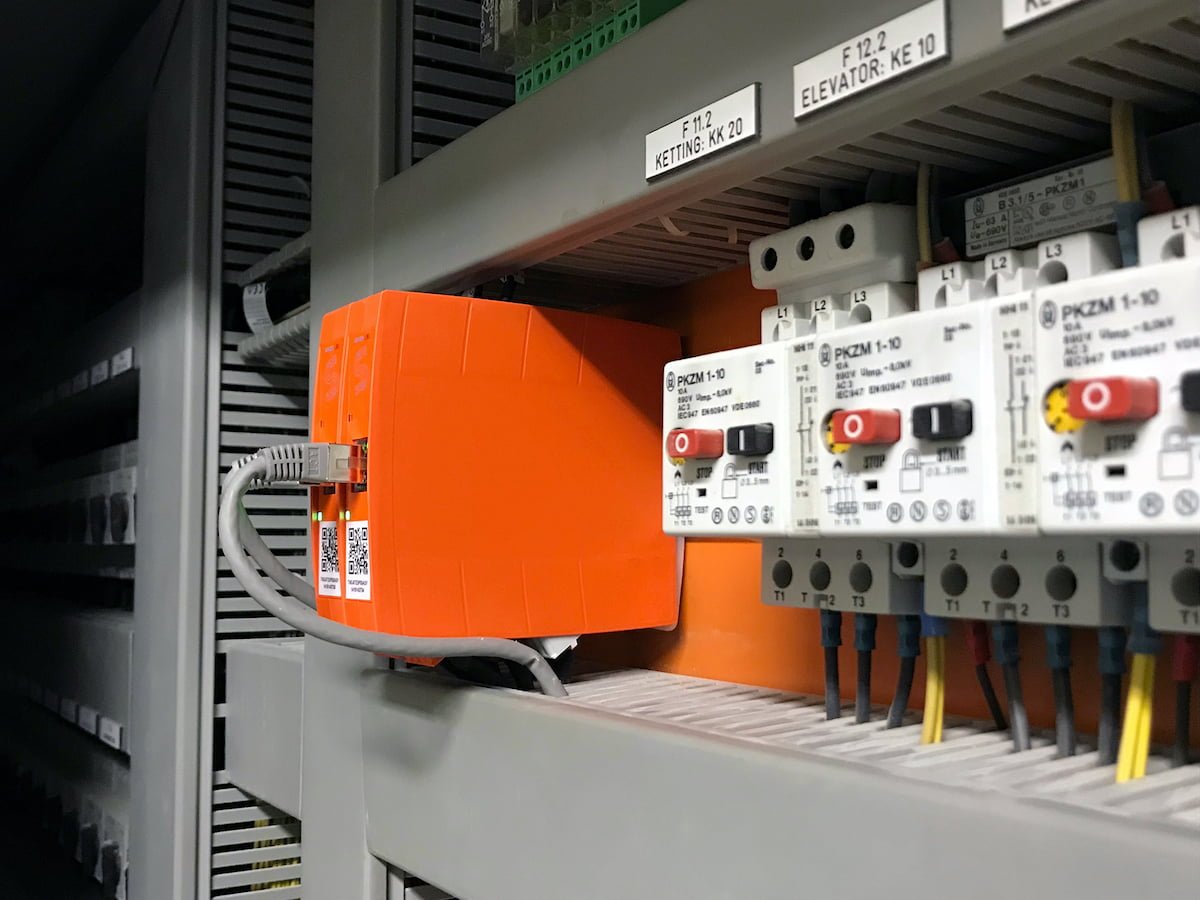
Damaged equipment can also be repaired as soon as it starts to degrade, when repairs are faster and cheaper allowing pumps to operate closer to BEP and extending machine lifetime. Monitoring remotely, using high-frequency sensors located in a pump’s motor control cabinet, avoids the cost of performing site visits to pumps to perform inspections and gather data. This in turn provides more flexibility with scheduling.

How SAM4 pump performance curve accurately estimates pressure and flow
SAM4, and all of its incorporated features, works on the principle of electrical signature analysis (ESA). This is based on the fact that subtle changes in a machine’s operation affect the connected motor’s electromagnetic field, which then affects the supply voltage and operating current.
SAM4 continually analyzes high-frequency current and voltage signals using powerful machine learning algorithms. This can reveal pump characteristics such as impeller rpm, reveal factors that could cause faults to develop such as pump cavitation, and identify developing faults.
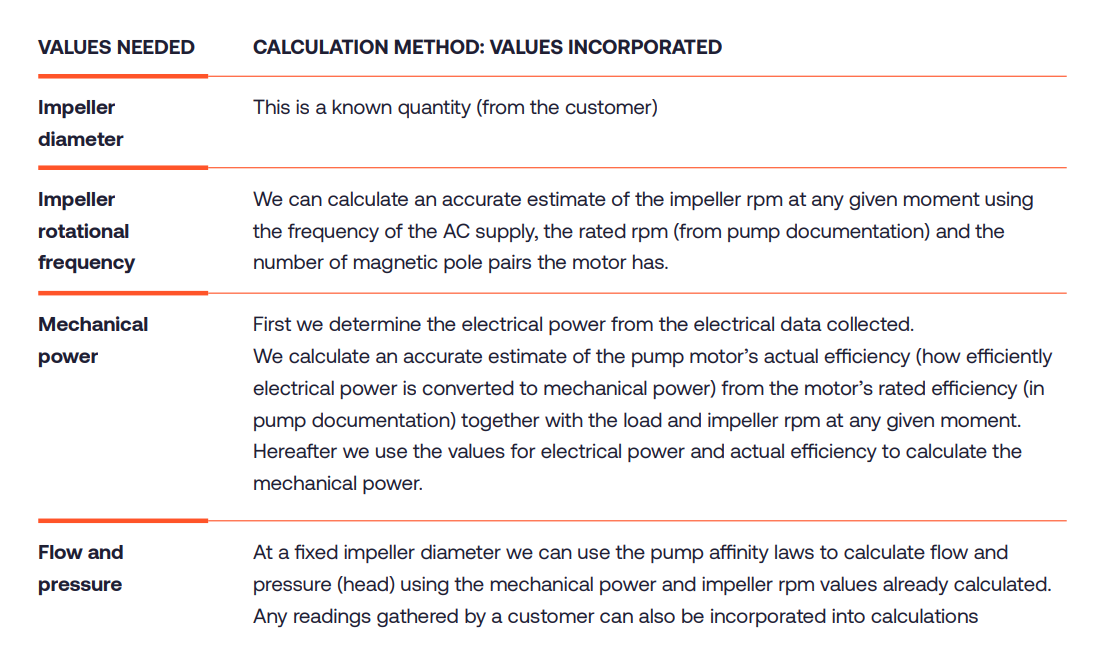
To map real-time pump operations against its pump curve, accurate estimations of pressure (head) and flow are calculated using electrical data, known values from pump documentation and the centrifugal pump affinity laws. These express the relationship between variables involved in pump performance (such as head, flow rate, impeller diameter, impeller rotational frequency) and mechanical power.

Case 1: Blockage quickly detected at a water company pumping station
At a pumping station with three co-located pumps SAM4 detected signs of cavitation and clogging in the data analyzed for one of the pumps of its customer in the water industry. The other two pumps did not show similar behavior. Differences in the active power indicated that the faulty pump was unable to produce the required flow. The expectation was that the pump was partly clogged causing the flow to drop and cavitation to occur. The situation was clear to see on the associated real-time pump
curve (Figure 4) where a great degree of the operating data points were in the bad practice area.
Once informed the customer inspected the pump and clogging was indeed discovered. Once the blockage was cleared the data returned to normal values (Figure 4). The detection of this blockage was very beneficial to the customer as resolving the issue prevented any further issues downstream. The customer calculated that between €20,000 – 40,000 in savings were generated due to saving on the cost of a full repair and additional costs for the pump station being unable to fulfill its duties.
Case 2: Solving inefficient pump operations to reduce energy consumption
Three pumps (two larger 55 kW pumps and a smaller 11 kW pump) forming the core of a clean water pumping station were being analyzed by SAM4. The SAM4 platform informed the water company that the two larger pumps were often used inefficiently to supply flow rates that could be independently covered far more efficiently by the smaller pump. The situation could be clearly visualized on the pump curve where the two larger pumps operated only just over 20% in the best practice zone and the smaller pump operated three quarters of the time in the bad practice zone.
SAM4 further determined that a significant part of the energy losses were due to the mode of operation. Using SAM4 recommendations, the customer implemented two simple setting changes to achieve more efficient pumping during low-flow periods. Firstly, the flow threshold at which the smaller pump delivered flow was increased as it could deliver the low flow independently and more efficiently than the two larger pumps. Secondly, the speed of the smaller pump was increased in order to further widen the useful operating range of the smaller pump to deliver increased flow at the required pressure. This was performed by increasing the supply frequency of the VFD, without exceeding the motor’s nominal power and pump’s capabilities. This resulted in a larger feasible flow range for the smaller pump, only switching on the larger pumps when this was truly necessary. The customer was able to implement these changes in a matter of hours and this involved no additional capital expenditure.
Once these simple process changes were implemented the before and after situation could immediately be compared and the improvement calculated. All three pumps were operating closer to their best efficiency point and the total pump station efficiency improved by 7.1%.
Conclusion
The SAM4 real-time pump curve provides a continuous and accurate method to see where a pump is operating in real time against its pump curve and hence how close to its BEP. Rather than making an educated guess as to which pump to test next, the SAM4 real-time pump curve provides continuous insight into which pumps lag the most, and should be prioritized.
This mitigates the need and cost associated with performing pump visits to take pressure and flow measurements and enables companies to detect issues associated with their pumps much quicker. This reduces downtime, lowers costs and provides much greater flexibility with maintenance scheduling.
Many companies already use SAM4 predictive maintenance system which includes the pump performance suite. The suite with its real-time pump curve feature monitors the health and performance of industrial pumps (and other equipment), which helps in reducing downtime, lost production, and operating and capital costs.


