
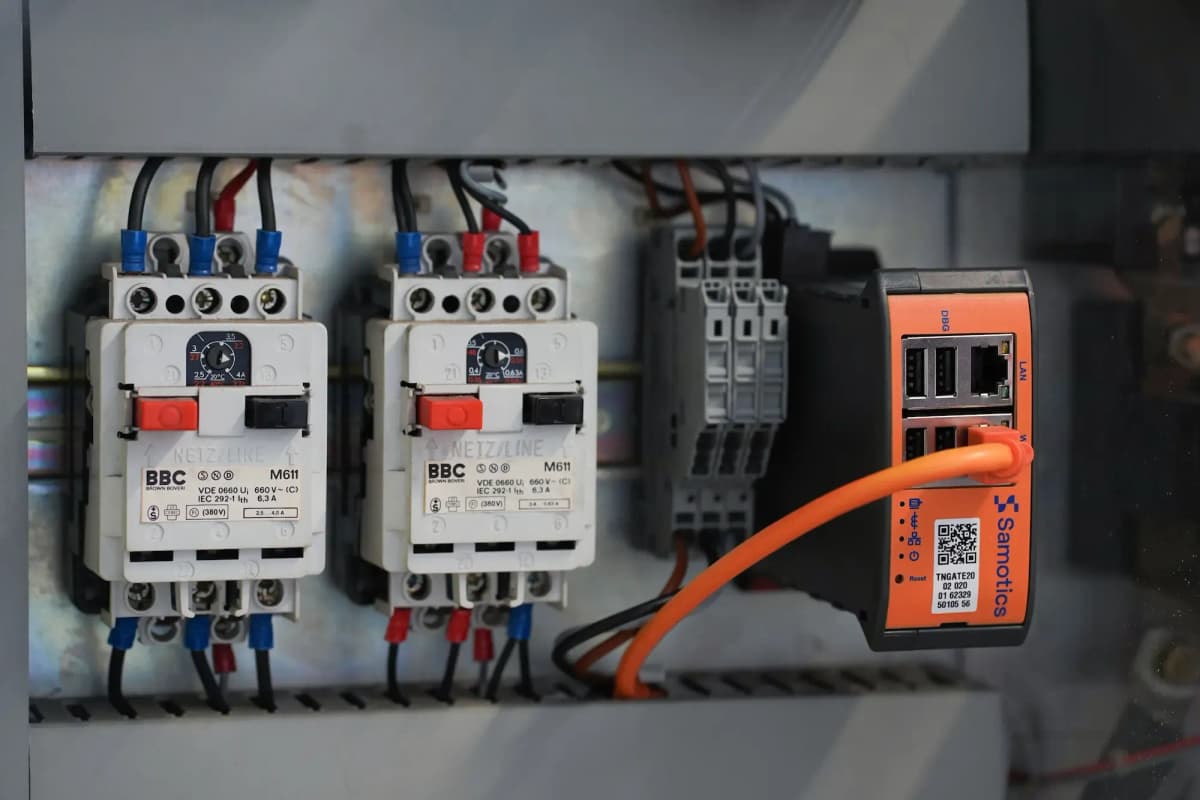
How SAM4 uses current and voltage to detect developing faults, guide maintenance and assess energy use from the electrical cabinet.
The motor connects electrical behaviour to the mechanical load it drives.
Current and voltage
Electrical measurements provide the starting evidence.
Motor, transmission and load
Changes can originate in the motor or its driven load.
A decision in context
The signal, operating conditions and inspection belong together.
The machine leaves a signature.
Electrical signature analysis (ESA) uses electrical measurements, including current and voltage, to assess equipment condition and operation.
This guide focuses on motor-driven equipment: pumps, fans, compressors, conveyors and the transmissions that connect them. It explains how ESA works and how Samotics applies it through SAM4.
The motor links electrical input to mechanical work through the magnetic field between its stator and rotor. A change in shaft load or that magnetic balance can alter the current. ESA reads this response. With SAM4, measurements come from the motor control cabinet, even when the asset is submerged, enclosed or difficult to reach.
1. Measure
Capture current and voltage from the motor supply.
2. Connect
The motor couples electrical input to the mechanical load.
3. Observe
A change in the load may appear in the motor’s electrical response.
How is ESA different from MCSA?
Motor current signature analysis (MCSA) focuses on current. ESA also considers voltage and quantities such as power. The broader technique has applications beyond motor-driven systems; this article concentrates on the equipment monitored by SAM4. Supplier coverage should be checked against the actual motor, drive and load.
From a waveform to a useful pattern.
A waveform shows how current or voltage changes over time. A Fast Fourier Transform (FFT) separates a sampled waveform into frequency components. This spectrum helps an analyst find small, repeated changes alongside the main electrical signal.
Some disturbances modulate the current: they change its amplitude or timing. In a simplified example, a repeating change in load can introduce components on either side of the supply frequency. These are called sidebands.
Current over time
Idealised amplitude spectrum
A simplified 50 Hz signal produces one main frequency component. Select “With modulation” to see how a repeating variation changes the pattern.A repeating 10 Hz variation produces components at 40 and 60 Hz around the 50 Hz carrier. Operating context is needed before a measured pattern can support a diagnosis.
Analysis examines where components appear, how they change and whether they repeat at comparable speed and load. This helps separate a developing fault from a normal change in operating duty. Trends over time add evidence that a single spectrum cannot provide.
Why measure voltage too?
Voltage provides context about the supply. Reading it alongside current helps distinguish a change at the electrical input from a change in how the motor and load are behaving.
Technical note: what the example calculates
The steady signal is a 50 Hz sine wave. The second signal varies its amplitude at 10 Hz: i(t) = [1 + 0.3 cos(2π × 10t)] sin(2π × 50t). The ideal spectrum has components at 40, 50 and 60 Hz. Each sideband has 0.15 times the carrier amplitude. The chart shows these analytical components, not an FFT calculated from the short time window displayed above. The 10 Hz modulation is illustrative and is not assigned to a particular fault.
Further reading: Research on load variation and current-based diagnosis.
Faults ESA can help identify.
ESA can reveal electrical faults in the motor and changes in the equipment it drives. The signal path matters: an electrical imbalance is observed differently from a pump blockage or a worn bearing.
| Fault family | Path to the signal | Evidence to examine |
|---|---|---|
| Supply imbalance | Unequal phase voltages change the motor’s electrical input. | Compare phase voltage and current to identify a supply-side disturbance. |
| Stator and rotor faults | Winding faults and damaged rotor bars disturb the magnetic field. | Examine phase behaviour, harmonics and components related to motor slip. |
| Bearing degradation | Wear can change rotor motion, the air gap or the load on the shaft. | Look for modulation associated with bearing geometry and rotation. |
| Unbalance and misalignment | Uneven forces can change torque demand and shaft motion. | Check components related to running speed alongside the operating load. |
| Gear and belt faults | Wear, looseness or poor tension can change how torque reaches the load. | Relate spectral patterns to shaft speed, gear mesh or belt passage. |
| Clogging and cavitation | Flow restrictions or unstable hydraulic behaviour change pump loading. | Examine power, current variation and changes across the spectrum. |
These examples explain ESA mechanisms. Detection strength differs across fault families and assets; they are not equal-coverage claims for SAM4.
- Example change
- Voltage imbalance or a change in supply quality.Rotor damage or a change in the motor’s electromagnetic balance.Cavitation, a restriction or changing torque demand in the driven machine.
- What analysis looks for
- The relationship between measured voltage and current, including imbalance and harmonic content.Changes in expected components and sidebands, interpreted with slip, speed and load.Load-related variation and changes in spectral features, checked against operating conditions.
Technical detail: bearing frequencies
Common bearing frequencies include cage frequency (FTF), ball-pass frequency of the inner race (BPFI) and outer race (BPFO), and ball-spin frequency (BSF). They depend on bearing geometry and speed.
A defect can create repeating forces that modulate the motor current. The resulting electrical components need interpretation: they are not always simple peaks at the bearing’s mechanical frequencies. Fault location, load and the transmission path affect how clearly they appear.
What affects detection confidence?
Motor and drive configuration, speed, load, duty cycle and data quality shape the signal. Bearing, gearbox and hydraulic signatures also depend on where the fault sits and how strongly it affects the motor.
SAM4 scopes the equipment and target fault families before rollout. Its published coverage guide distinguishes fault classes with different levels of field evidence. Read the coverage and applicability guide.
Technical references: Review of motor fault detection · Current-based gearmotor research.
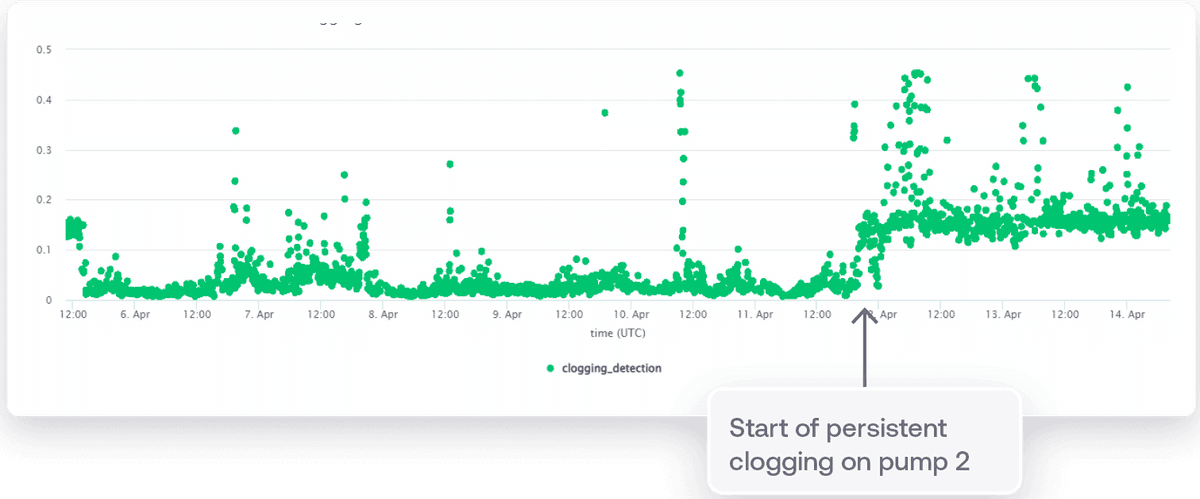
Yorkshire Water: a blocked pump inlet.
SAM4 detected developing clogging on one of two sewage pumps at a Yorkshire Water pumping station. Continued monitoring and further investigation helped the team locate the obstruction.
From an electrical change
to a targeted inspection.
- Detection
- A rising clogging indicator persisted. The customer arranged an OEM inspection of the pumps.
- Diagnosis
- Before the visit, Samotics specialists reviewed spectral energy and active power. Cavitation indicators prompted advice to check outside the pump, including the inlet and discharge side.
- Confirmation
- The OEM confirmed a blocked inlet. The customer cleaned the well and pump inlet.
- Follow-up
- Subsequent monitoring indicated that the pump had returned to healthy behaviour.
Detection results with their context.
Samotics reports the following results for its reviewed monitoring cohort.
Basis: 2,087 reviewed events in the 12 months ending 1 May 2026. The scored sample is weighted towards submerged sewage pumps. Results vary by asset and fault type.
What these metrics mean
Recall is the share of confirmed faults detected by SAM4. The false-alert share counts alerts that reached customers and were later classified as false. The metrics use different denominators; neither is a universal accuracy score.
The figures are published by Samotics. Consult the validation methodology and asset-specific results when assessing your equipment.
Choose for the asset and the question.
ESA is particularly useful when access to the machine is difficult or the fault has a direct electrical signature. Vibration provides local mechanical evidence; thermography reveals surface heat patterns. The best measurement depends on the asset and the fault being investigated.
ESA
- Measures
- Current, voltage and related electrical behaviour.
- Useful for
- Electrical faults, plus mechanical and process changes visible through the motor. Useful for submerged, enclosed and distributed assets.
- Consider
- Signal path, drive configuration, speed and load. Cabinet access can help when the machine is difficult to reach.
Vibration
- Measures
- Mechanical motion at a measurement point.
- Useful for
- Local mechanical diagnosis, including bearing and alignment problems where the vibration path to the sensor is strong.
- Consider
- Sensor placement and transmission paths. Both route-based and continuous remote systems are available.
Thermography
- Measures
- Infrared radiation used to assess surface temperatures.
- Useful for
- Investigating thermal patterns in electrical and mechanical equipment.
- Consider
- View of the relevant surface, emissivity and operating load. Fixed systems can provide continuous monitoring.
Installation access and remote monitoring are different questions. A vibration sensor can send data remotely after it has been fitted to the machine. ESA moves the measurement point to the cabinet, which can make ongoing coverage practical when asset access is difficult.
Electrical faults may appear in current or voltage before they produce clear mechanical or thermal symptoms. For other faults, a nearby vibration sensor may give stronger evidence. Use both when their independent measurements help resolve the maintenance question.
Method references: SKF condition monitoring · FLIR continuous thermal monitoring.
From measurement to a maintenance recommendation.
SAM4 combines continuous electrical monitoring, fault analysis and support from Samotics reliability engineers. Your team receives findings with evidence and recommended checks.
Capture the electrical behaviour.
Cabinet hardware collects current and voltage. High-frequency waveform data supports spectral analysis; trends show how the asset runs over time.
Recognise patterns and changes.
Physics-based models look for known fault signatures. Asset baselines show departures from normal behaviour. Speed and load provide context for both.
Review the diagnosis.
Samotics reliability engineers review ambiguous findings and help interpret the evidence, assess severity and recommend checks.
Plan and record the response.
The finding brings fault type, severity, evidence and advice together. Your team plans the inspection or repair and records what was found.
Read the SAM4 analysis and delivery workflow.
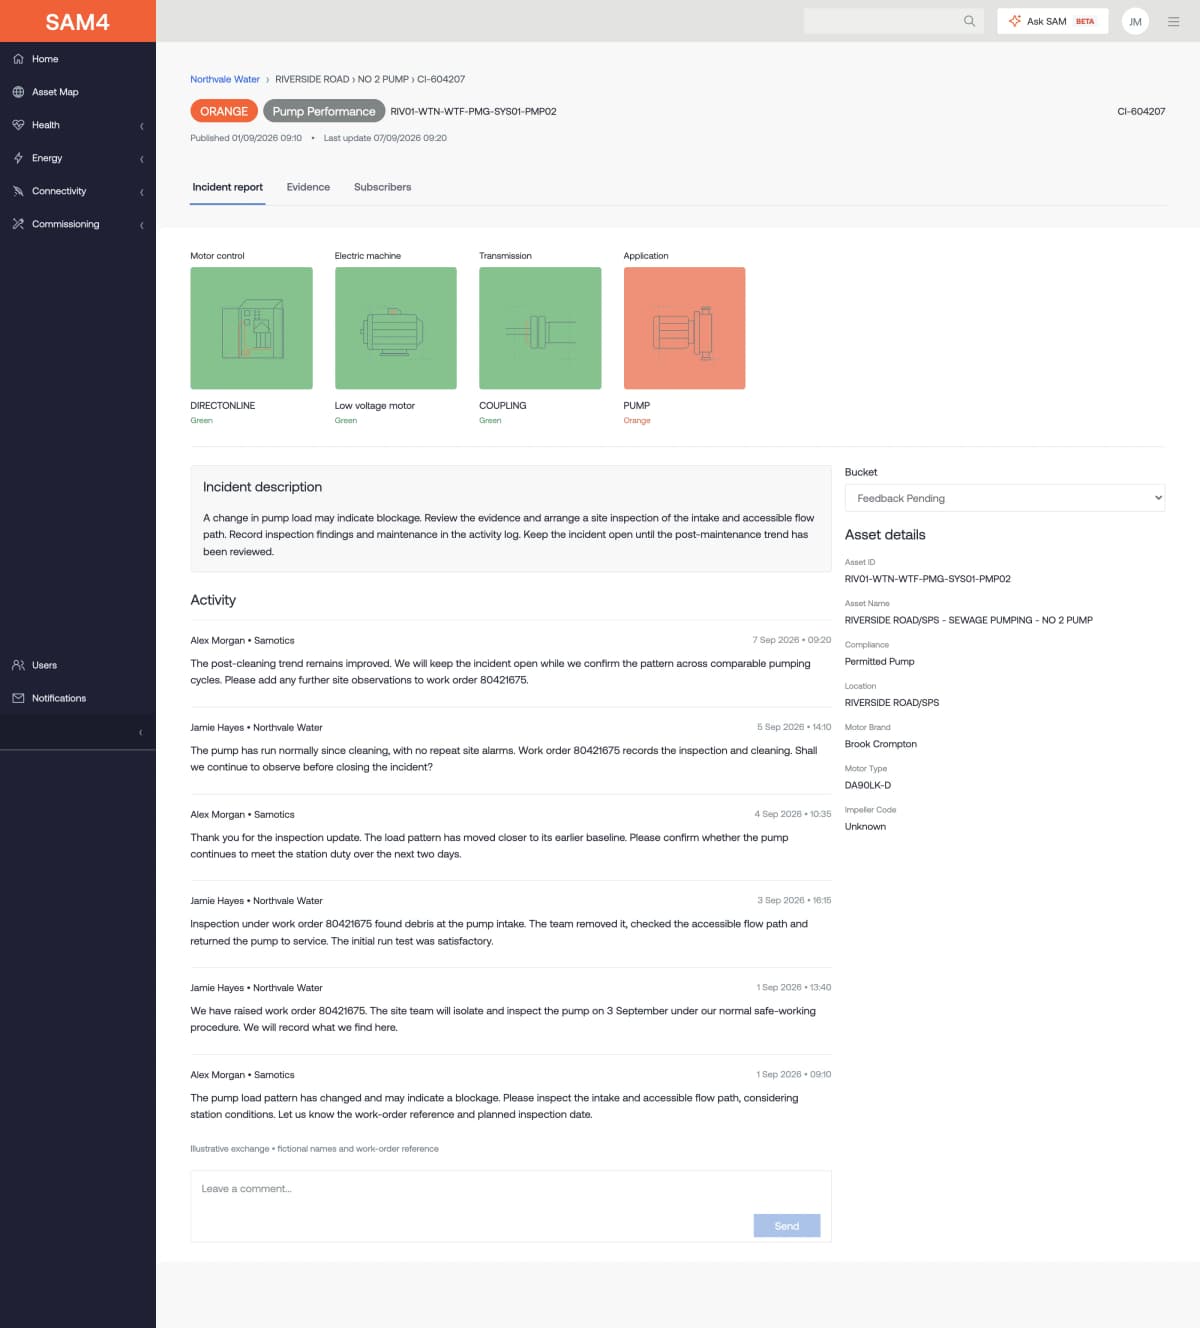
Keep the finding
and the response together.
- Locate the asset and reported issue.
- Review evidence and recommended checks.
- Record inspection and maintenance findings.
Installation, commissioning and delivery
The published installation guide describes a typical install of under 60 minutes per asset once safe access and site approval are in place. Voltage connections require brief cabinet de-energisation.
Commissioning checks signal quality and asset settings. The operating baseline develops as data arrives. Findings can be viewed in SAM4 and connected to maintenance systems through the agreed integration setup.
Use the same measurements to assess duty.
Current and voltage also show how equipment uses energy. SAM4 calculates consumption and operating trends, then uses motor and pump information to estimate performance. Engineers can use these views to find assets worth investigating.
- Consumption and runtimeCalculated from electrical data
- Compare energy use, running hours and starts across assets. Check whether high consumption comes from long duty, high load or a change in operation.
- Motor and supply lossesEstimates and electrical indicators
- Review loss estimates, loading and power quality. Assess whether equipment sizing, supply issues or controls deserve a closer look.
- Pump operating pointEstimated for supported configurations
- Compare estimated head and flow with the pump curve and best efficiency point (BEP). Check whether the pump’s duty fits the process demand.
7.1% station-level efficiency improvement.
At Hoenderloo, SAM4 identified inefficient low-flow operation. Vitens changed pump changeover settings and the speed of a smaller pump. Samotics reports a 7.1% station-level efficiency improvement following the three-pump control change.
This is an efficiency result for that operating change, not a guaranteed reduction in electricity cost.
Read the energy method and Vitens example →Estimated opportunities help set priorities. Before claiming savings, compare energy use before and after the change on a like-for-like duty basis. Explore the energy and pump-performance views.
Before you start.
Can ESA work with a variable-frequency drive?
Yes, for supported drive and motor configurations. Drive harmonics and speed changes affect the signal, so the setup and measurement quality are checked during scoping.
What installation work is needed?
Measurement hardware is fitted in the cabinet and commissioned against the asset settings. Plan safe access and brief de-energisation for voltage connections. Ongoing monitoring does not require a sensor on the inaccessible machine itself.
How much warning will we get?
It depends on the fault and how it develops. In an anonymised field example published by Samotics, a rising indicator prompted an alert in week 4. Planned maintenance followed in week 5, and the indicator returned to baseline in week 6. This illustrates a planning window; it does not define a standard warning period. See the published timeline.
Will we need an ESA specialist on site?
Samotics provides diagnostic support and recommended checks. Your maintenance team brings the site context, assesses operational risk and plans the work. Optional access to supporting evidence helps engineers discuss a finding in more depth.
How should we assess the financial return?
Use the site’s energy tariff, operating hours, maintenance costs and planned response. For energy changes, compare consumption at equivalent duty. For fault detections, distinguish recorded repair costs from estimated avoided downtime. These inputs support an asset-specific business case.
Sources and further technical reading
- Samotics: how ESA detects faults from electrical measurements.
- Lack of oil lubrication in gearmotor systems: current-based diagnostic research. Sensors, 2022.
- Early Detection of Faults in Induction Motors: a review. Energies, 2022.
- Yorkshire Water: identifying a blockage outside the pump. Published Samotics case study.
- SKF: connected condition-monitoring technologies.
- FLIR: continuous thermal monitoring.
- SAM4: analysis, engineering support and delivery.
- SAM4: current installation guide.
- SAM4 energy method and the Vitens outcome.
Discuss the assets
you need to monitor.
Bring your asset list, operating conditions and target faults. Discuss monitoring coverage, installation and how findings reach your team.
Capture current and voltage from the motor supply.
The motor couples electrical input to the mechanical load.
A change in the load may appear in the motor’s electrical response.