01
Mechanical change
Mechanical changes affect load
Bearing wear, imbalance, cavitation, misalignment, and process changes can alter torque, speed, or load. The driven machine starts asking the motor to work differently.

Electrical Signature Analysis measures current and voltage at the motor control cabinet, then analyses the signal for fault patterns linked to the motor, drivetrain, and driven load. Detection runs on two layers in parallel: physics-based models for known fault signatures, and asset-specific baselines for each machine's own healthy envelope. SAM4 uses ESA to monitor hard-to-reach motor-driven assets without installing sensors on the machine.
01
Mechanical change
Bearing wear, imbalance, cavitation, misalignment, and process changes can alter torque, speed, or load. The driven machine starts asking the motor to work differently.
02
Motor response
The motor converts electrical energy into rotation through the magnetic field between stator and rotor. When load or magnetic balance changes, current and voltage can change in small but repeatable ways.
03
Cabinet measurement
SAM4 captures current and voltage at the motor control cabinet and analyses the signal in the frequency domain. No sensor is needed on the asset.
An induction motor links the electrical supply to the mechanical system. When the motor, drivetrain, or driven load changes behaviour, the motor can draw current differently. ESA reads those changes at the motor control cabinet.
Causal chain
Inside the motor, the rotor and stator are separated by a narrow air gap. In healthy operation, magnetic flux across that gap follows a stable pattern for a given speed and load.
Motor-internal faults can disturb that electromagnetic balance. A worn bearing may shift rotor position. Rotor bar damage can alter the magnetic field. Winding degradation can affect phase behaviour.
Downstream faults are also detectable, but through a different path. Cavitation, blockage, belt slip, gearbox wear, or misalignment can change torque demand, speed stability, or load. The motor responds electrically to those changes.
Fault-related changes can create small, repeatable variations in current and voltage. In the frequency domain, those variations appear as components, harmonics, or sidebands around expected electrical and mechanical frequencies.
The signature depends on the asset, load, speed, drive configuration, signal path, and fault severity. That is why SAM4 combines physics-based fault models with asset-specific baselines and operating context. The Physics-first ESA section below describes how SAM4 separates fault patterns from operating context.
Cabinet-installed measurement hardware captures current and voltage from the motor supply. The waveforms are sampled at high frequency and transformed into spectral features using methods such as Fast Fourier Transform and wavelet analysis.
The takeaway: the motor couples electrical and mechanical behaviour. Faults that change torque, speed, load, or electromagnetic balance can leave repeatable signatures in current and voltage. SAM4 reads those signatures at the cabinet and validates them against asset context. Detection strength varies by asset type, operating regime, load stability, and fault mechanism.
A motor-driven system links the electrical supply to the driven load. Electrical energy flows forward through the drive, motor, coupling, and machine. Fault evidence can appear in the opposite direction: mechanical and process changes alter torque, speed, load, or electromagnetic balance, and those changes can show up in current and voltage at the motor control cabinet.
Faults can originate in the motor, coupling, gearbox, belt, pump, fan, compressor, or process.
The fault changes torque demand, speed stability, load, drag, slip, or electromagnetic balance.
Those changes can create repeatable components, harmonics, or sidebands in the current and voltage spectrum.
SAM4 captures high-frequency current and voltage at the motor control cabinet and analyses the signal for fault evidence. No sensor is installed on the asset.
Power flows forward. Fault evidence can appear backward through the motor's electrical behaviour. SAM4 reads that evidence at the MCC.
Evidence strength varies by asset type, fault mechanism, operating regime, load stability, drive configuration, and signal path. SAM4 reports performance by asset type instead of relying on one blended number across all machines.
See asset-specific recall figures →SAM4 captures high-frequency current and voltage waveforms at the motor control cabinet. Those waveforms are transformed into spectral features, where many electrical, mechanical, and process-related fault patterns become easier to separate. SAM4 then runs two analysis tracks in parallel: one looks for known fault signatures grounded in physics, and the other compares each asset against its own healthy baseline.
A non-exhaustive sample of patterns SAM4 looks for. Specific frequencies, harmonics, and indicators depend on asset type, drive configuration, and operating regime.
Can increase negative-sequence current and selected harmonic indicators.
Can produce sidebands around the supply frequency related to motor slip.
Can produce rotor-slot and running-speed-related components.
Can create modulation patterns associated with BPFO, BPFI, BSF, and FTF.
Can create rotational-frequency components and sidebands, often involving 1× and 2× running speed.
Can raise broadband energy and create unstable load-related patterns.
Current shows how the motor responds to load, torque, speed, and electromagnetic changes. Voltage helps separate those effects from supply-side disturbances such as voltage imbalance, harmonic distortion, and grid-related variation. Measured together, they let SAM4 distinguish a developing asset fault from a power quality issue.
Signal strength depends on asset type, load stability, operating regime, drive configuration, and fault mechanism. SAM4 reports performance by asset class rather than relying on one blended metric.
See asset-specific recall figures →Reading the spectrum
The claims above are checkable. These three examples show what a current spectrum contains, how mechanical disturbance appears in it, and what a real fault family looks like. The maths is included so your own engineers can verify the mechanism.
Every current spectrum has the same skeleton. The supply frequency fs dominates: the 50 or 60 Hz the grid feeds the motor. Harmonics sit at integer multiples (2fs, 3fs), shaped mostly by the grid but also by asymmetries downstream: cables, the motor itself, electromagnetic couplings.
Everything else rises from the noise floor. Fault evidence lives in what appears between and around these expected components.
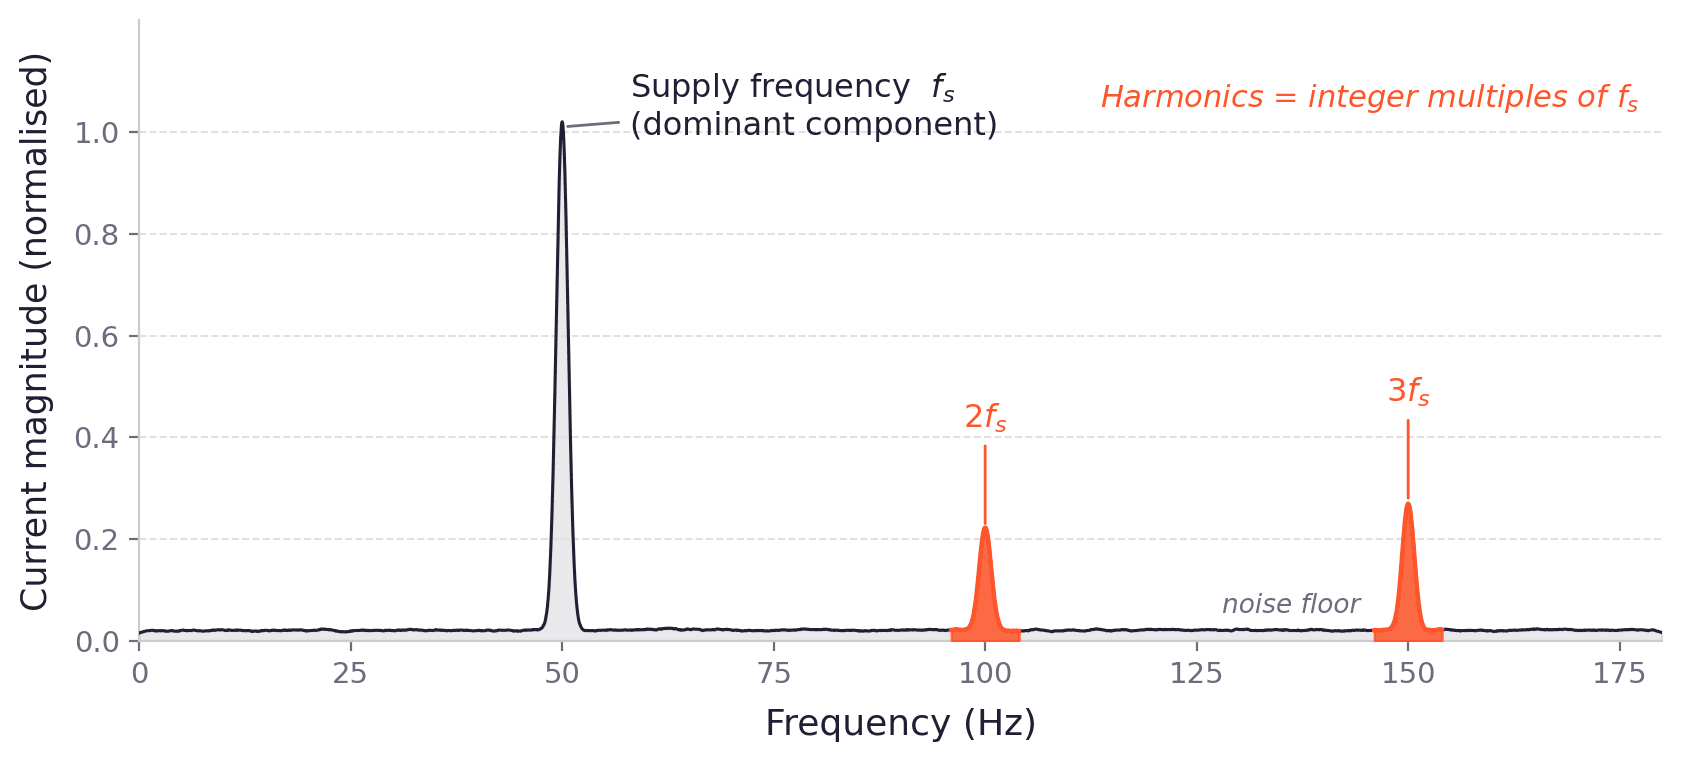
The maths: harmonics
x(t) = Σn=1..∞ An cos(2π·n·fs·t + φn) ⇒ harmonics at fn = n·fs (n = 1, 2, 3, …)
A disturbance at frequency fr modulates the supply and creates symmetric sidebands at fs ± fr. The usual sources are electromagnetic asymmetries, often those that vary the air gap or put torsional torque on the shaft.
This is the mechanism that lets ESA observe mechanical behaviour electrically: vibration on the shaft is reflected as sidebands in the current.
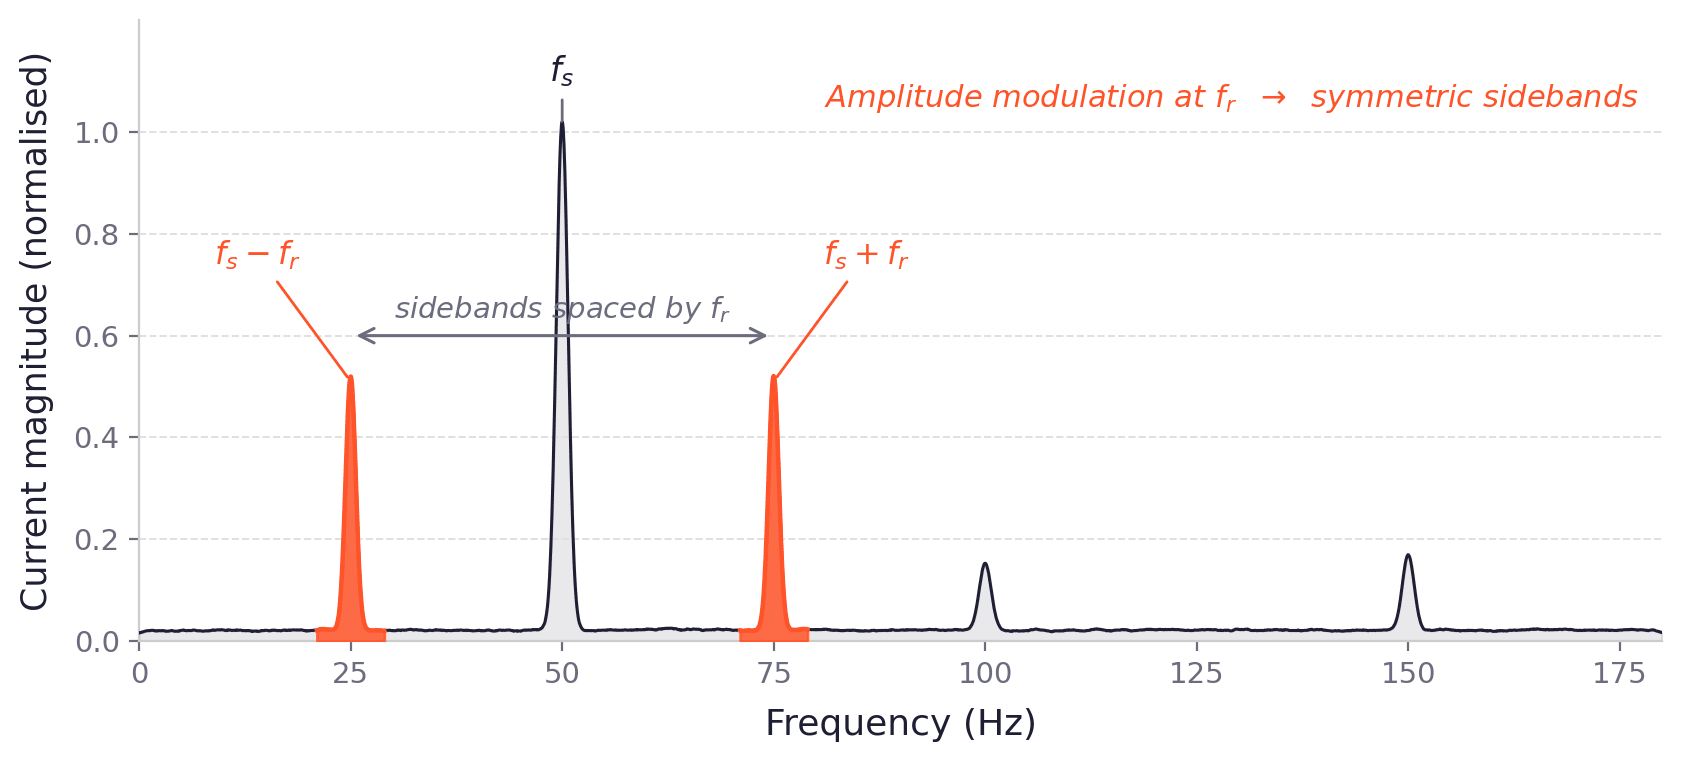
The maths: sidebands and rotor speed
[1 + m·cos(2πfrt)]·cos(2πfst) = cos(2πfst) + (m/2)·[cos 2π(fs−fr)t + cos 2π(fs+fr)t]
⇒ a modulation at fr splits the supply into peaks at fs and fs ± fr
ns = 2fs/P (rev/s), fr = ns(1−s). For a 4-pole motor: fr ≈ fs/2, so sidebands sit near 25 and 75 Hz on a 50 Hz supply, minus slip.
Product-to-sum identity: cos a · cos b = ½[cos(a−b) + cos(a+b)]
A belt drive adds its own components: belt pass and pulley output frequencies, both appearing as sidebands of the supply frequency. Their exact positions follow from the pulley diameters, belt length, and rotational speed.
As a belt wears, several of these components tend to rise together, rarely just one. That co-movement is the tell SAM4's belt-wear models are tuned to.
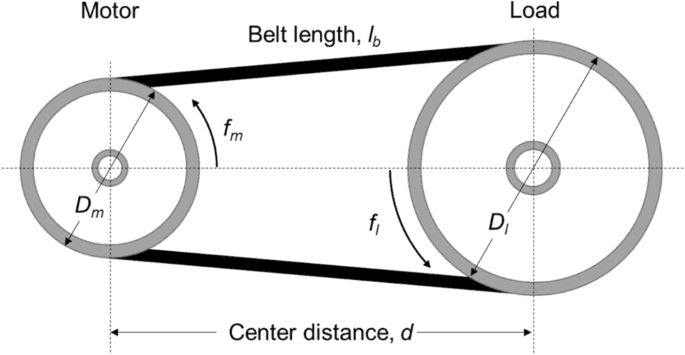
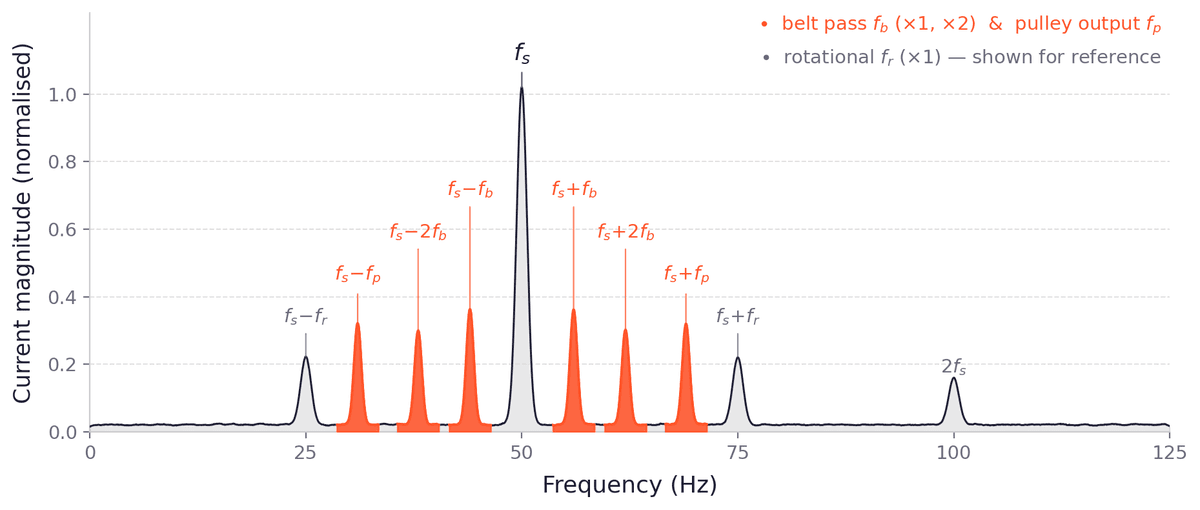
The maths: belt-transmission components
Belt pass: fb = fs ± k·(π·Dmotor/L)·fr (k = 1, 2)
Pulley output: fp = fs ± k·(Dmotor/Dload)·fr (k = 1)
D = pulley diameters · L = belt length · fr = rotational frequency · k = harmonic order. Both families appear as sidebands of fs.
SAM4 has detected the fault classes below in operating assets. Detection confidence depends on the asset type, drive configuration, duty cycle, load stability, signal quality, and whether the fault creates a measurable change in current, voltage, torque, speed, or load.
Use this table as a detection-fit guide, not a blanket coverage guarantee. The strongest candidates are assets where the fault changes the motor's electrical signature through load, torque, speed, hydraulic behaviour, or electromagnetic balance.
Maturity reflects the strength of confirmed field outcomes per fault mode: Proven (≥95% recall on an adequate scored sample), Effective (85 to 94%), Developing (65 to 84%), Early-stage (<65%).
A Proven label does not always come with a published percentage. Where the scored sample for a fault mode is below 50 cases, we lead with physics and confirmed cases rather than a pooled headline; exact counts are in the validation report.
Detection performance depends on asset type, operating regime, drive configuration, signal quality, and fault mode.
| Detection class | Signal path | Best-fit assets | Maturity | Boundary |
|---|---|---|---|---|
| Clogging / blockage | Process / load-path | Pumps, submerged sewage pumps | Proven | Strongest when blockage changes load, hydraulic behaviour, or duty pattern. |
| Process-induced load deviation | Process / load-path | Pumps, fans, mixers, conveyors | Proven | Detects load-pattern changes including flow disturbances, sequencing anomalies, and operating-point drift. Limited to deviations that change motor load. |
| Mechanical unbalance | Electromechanical | Pumps, fans, conveyors | Proven | Strongest when unbalance affects torque, speed, current, or voltage signature. |
| Voltage imbalance | Direct electrical | Motor-driven assets | Proven | Applies where phase imbalance is visible in the measured supply voltage. |
| Belt degradation | Transmission / load-path | Belt-driven systems | Proven | Strong where wear, slip, or tension loss changes speed or load behaviour. |
| Belt misalignment / tracking issue | Transmission / load-path | Belt-driven systems | Proven | Visible when misalignment affects load, friction, speed, or belt behaviour. |
| Fouling or contamination causing load change | Process / load-path | Fans, conveyors, compressors | Proven | Indirect; detects the load effect, not contamination itself. |
| Bearing degradation indicators | Electromechanical | Pumps, conveyors, mixers, blowers | Developing | Detection depends on asset type, fault location, speed, load, and signal path. |
| Shaft or coupling misalignment | Electromechanical | Pumps, fans | Developing | Strongest when misalignment changes torque, speed, load, or current signature. |
| Cavitation | Process / hydraulic load | Pumps | Developing | Detected through current variance and hydraulic load-signature shifts. Field-confirmed on centrifugal, anolyte, and sewage pumps. |
| Air lock | Process / hydraulic load | Submerged sewage pumps | Developing | Strongest when air lock creates a distinct load or hydraulic signature. |
| Coupling-related load anomaly | Transmission / load-path | Pumps, conveyors | Developing | Visible when coupling mass or alignment effects appear as torque, speed, or load changes. |
| Gearbox degradation or gear-mesh anomaly | Transmission / load-path | Conveyors, fans, mixers, pumps | Developing | Detection depends on gearing, load path, fault progression, and signal strength. |
| Impeller degradation | Process / load-path | Pumps | Developing | Detected through sustained hydraulic load and efficiency drift the impeller wear introduces. Field-confirmed on submerged and centrifugal pumps. |
| Seal-related load anomaly | Process / load-path | Pumps | Early-stage | Not direct leak detection; visible only when seal issues create measurable load, hydraulic, or electrical effects. |
| Pulley degradation | Transmission / load-path | Belt-driven systems | Developing | Strongest when pulley wear affects belt speed, slip, tension, or load. |
| Soft foot indicators | Electromechanical | Fans | Developing | Detection depends on whether mounting distortion creates a measurable electrical or load effect. |
| Stator winding short indicators | Direct electrical | Motor-driven assets | Developing | Detection depends on severity, signal quality, and electrical configuration. |
| Overloading | Process / load-path | Compressors, conveyors | Developing | Detects sustained or abnormal load patterns, not every short transient. |
SAM4 does not directly measure flow, pressure, vibration, temperature, product quality, or process chemistry. It detects faults when they create measurable changes in current, voltage, torque, speed, load, or electrical balance.
Some failure modes remain better covered by vibration, process instrumentation, OEM monitoring, inspection, oil analysis, or offline electrical testing.
Recall = FD / (FD + FM). False-alert rate = FC / (FD + FC). Audit window: 12 months ending 1 May 2026. Reviewed quarterly. Detection classes outside this table are not yet ready for public claims.
ESA works best when the motor signal contains stable, repeatable evidence of asset behaviour. Some faults appear directly in current and voltage. Others appear through changes in torque, speed, load, or electromagnetic balance. SAM4 scopes each fleet before rollout so detection confidence is clear before deployment.
SAM4 reviews asset type, motor configuration, drive setup, operating regime, signal quality, connectivity, and target failure modes before deployment. Where confidence is lower, this is reported upfront.
A single measurement tells you what the signal looked like once. Continuous monitoring tells you whether it repeats and how fast it grows. But growth alone is not a fault: the same motor draws different current at different speeds and loads. SAM4 estimates speed and load from the same waveform it analyses, and compares each new spectrum against the asset's own healthy baseline for that operating state. Three things matter together: the trend, the rate of change, and the operating point.
Speed from supply frequency. Load from active power. SAM4 baselines per operating state, so a process change does not look like a fault.
One measurement says a fault exists. The continuous curve tells you how fast it is developing. Periodic visits capture one condition; continuous monitoring captures the envelope.
Mechanical degradation rarely runs in a straight line. The plateau is the defect surface stabilising before it grows again. SAM4 reads non-linear patterns as continued degradation.
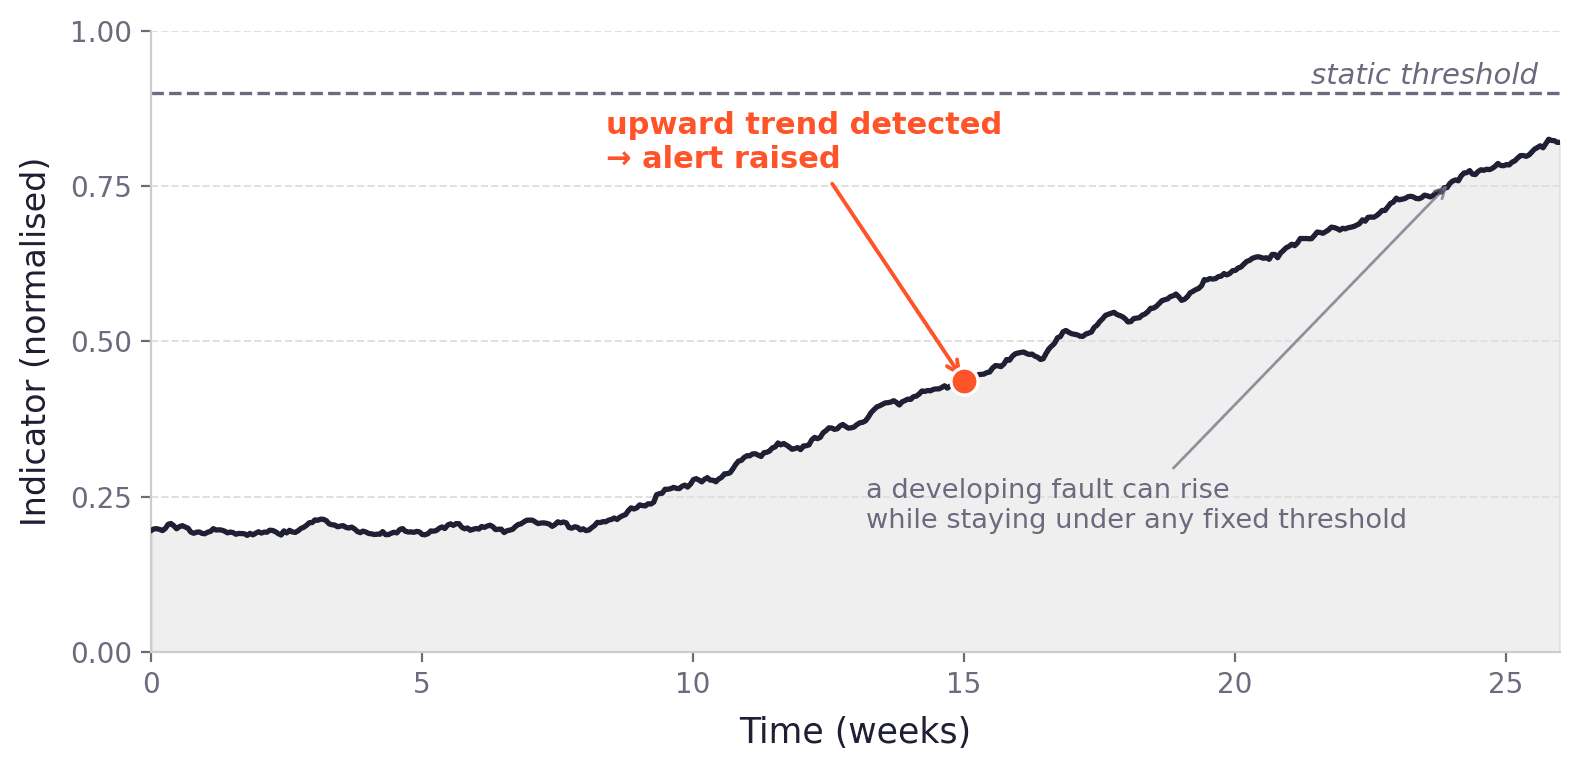
A developing fault can rise for weeks while staying under any fixed threshold. A static alarm level either misses it or, set tight enough to catch it, floods the team with false alerts.
SAM4 alerts on the trend instead: each failure-specific indicator is tracked over time and judged against the asset's own baseline for that operating state. The alert fires when the trajectory is wrong, not when a single value looks alarming.
From the field · anonymised detection
Week 0
SAM4 observes a rising trend at a rotating drum's pass frequency (4.42 Hz) on a monitored drive at a European process plant.
Week 4
Alert sent. The site's routine vibration checks on the same asset read normal.
Week 5
The asset is stopped in a planned window and maintenance is carried out.
Week 6
The indicator returns to baseline. The maintenance findings confirm the detection.
Details anonymised for customer confidentiality. Asset-level case evidence, including scope rules and review criteria, is available to qualified technical evaluators in our validation reports.
ESA and vibration are complementary. Vibration is powerful when a sensor can be mounted close to the fault path. ESA adds visibility where the asset is hard to reach, the signal path is electrical, or the fault changes load, torque, speed, or power quality. Many customers use both: vibration for accessible high-criticality machines, ESA for hard-to-reach assets, electrical faults, and fleet-scale coverage.
Winding degradation, voltage imbalance, phase imbalance, and rotor bar defects often appear directly in current and voltage. Vibration may only see secondary effects later, if the fault begins to affect torque, heat, or mechanical behaviour.
Vibration sensors need a physical mounting point on or near the machine. ESA measures at the motor control cabinet, so submerged pumps, enclosed motors, ATEX-zone assets, and remote equipment can be monitored without routine asset access.
Vibration depends on mechanical energy travelling from the fault to the sensor. Couplings, housings, fluid, structure, mass, and mounting quality can attenuate or mask the signal. ESA reads the motor’s electrical response to changes in load, torque, speed, and electromagnetic balance.
SAM4 measures current and voltage together. Supply-side issues often appear first in voltage. Downstream mechanical or process issues often appear first in current. Comparing both helps separate power-quality issues from developing asset faults.
The asset is accessible and mechanical fault transmission to the sensor is strong.
The asset is hard to reach, electrical faults matter, or fleet-scale cabinet monitoring is more practical.
The asset is critical and you want independent evidence from two physical domains.
It extends condition monitoring to faults and assets vibration often misses: electrical issues, inaccessible machines, weak mechanical signal paths, and load or process changes visible through the motor’s electrical behaviour.
ESA is not a new signal trick. It builds on decades of motor current signature analysis, formalised ESA standards, and peer-reviewed research. SAM4 applies that science to live industrial fleets and validates performance against resolved customer outcomes.
Data basis: Recall is calculated from 1,437 confirmed fault events out of 2,087 reviewed. 12 months ending 1 May 2026. Reviewed quarterly. Recall = detected faults / confirmed faults. False-alert rate = false alerts / customer-facing alerts.
See full methodology →ESA traces back to motor current signature analysis for inaccessible motor-operated valves in nuclear safety systems. The principle remains the same: electromechanical faults can leave measurable signatures in current and voltage.
ISO 20958 defines condition monitoring and diagnostics using electrical signature analysis on three-phase induction motors. SAM4 builds on that method for online, fleet-scale monitoring.
ABB embedded Samotics ESA into its ACS880 drive portfolio. For compatible drives, SAM4 can analyse current and voltage signals already measured by the drive.
ESA methods have been studied in IEEE, EPRI, and condition monitoring literature for decades. SAM4 combines that physics with field data, asset-specific baselines, and expert validation.
“We invested heavily in condition-based maintenance: vibration, oil analysis, airflow, the lot. But those approaches can still be snapshots. SAM4 added continuous visibility, and that changes how confident you feel about what’s happening.”
Detection runs on two layers, each doing different work. First, physics-based models. SAM4 looks for known fault signatures at expected frequencies: rotor bar sidebands, bearing modulation patterns, voltage imbalance indicators, harmonic distortions. These signatures come from the physics of motor-driven systems and are codified in ISO 20958 and decades of ESA literature. They do not depend on training data. Second, asset-specific baselines. SAM4 also compares each new spectrum against that machine's own healthy envelope at the relevant operating state, not against a generic average across all assets. The baseline catches novelty and combined patterns the physics models do not name directly. The 7,000+ asset fleet strengthens both layers by expanding the validated catalogue of signatures and operating contexts. Scale supports detection. It is not the primary mechanism.
Not in the strict sense of a real-time, full-physics simulation of a machine. SAM4 builds a per-asset behavioural model of each monitored machine, comparing live current and voltage spectra against that machine's own healthy baseline at the relevant operating state. That layer is sometimes described as a digital twin in industry terminology, and it does the work many digital-twin products are sold to do: detect deviation from an asset's individual normal.
In SAM4, the per-asset model is one of two analysis layers in Physics-first ESA. The primary layer is physics-based fault detection, grounded in ISO 20958 and decades of ESA research. It identifies known fault signatures at expected frequencies, from the first measurement, without needing the model to have seen the fault before. The per-asset baseline is the second layer, useful for novel or combined patterns the physics models do not name directly.
A baseline-only approach, often branded as a digital twin or model-based platform, only catches what deviates from learned normal. It has no detection mechanism for a fault class the model has not seen examples of. Physics-based detection does. That is why Physics-first ESA leads with physics.
So: digital-twin-style behaviour for the baseline track, physics-grounded models for the primary track, expert validation before alerts reach your team.
Lead time depends on the fault mechanism, not the method. Faults that develop through load, torque, or speed changes often appear in the electrical signal weeks before functional failure. Fast-developing faults, such as clogging, give shorter windows.
For bearing faults specifically, vibration remains the stronger method on accessible machines; our maturity table above rates SAM4's bearing detection as Developing. ESA's advantage is coverage rather than raw speed: it monitors assets vibration cannot easily reach, and it sometimes catches what a vibration programme misses. At Schiphol Airport, SAM4 flagged bearing damage on a gearbox motor that the site's vibration monitoring had not picked up; inspection confirmed significant degradation.
Where both methods apply, they are complementary: independent evidence from two physical domains.
The motor needs to operate above approximately 30% of rated load for ESA to establish a reliable baseline. Below this threshold, fault signatures are too weak relative to electrical noise. SAM4 automatically flags low-load periods and excludes them from analysis.
SAM4 segments data by operating state. Each state gets its own baseline. When equipment cycles between loads, speeds, or idle, the model compares each operating window against the correct baseline. This is critical for assets like borehole pumps or batch-process compressors that run intermittently.
ESA as a method is codified in ISO 20958:2013 (condition monitoring using electrical signature analysis of three-phase induction motors fed from fixed voltage and frequency supplies). The underlying physics has been published in IEEE and EPRI since the 1980s. SAM4's implementation aligns with ISO 20958 for direct-on-line motors. For VFD-driven motors, SAM4 extends beyond the standard's scope using proprietary algorithms trained on real-world industrial data.
Request a demo and speak with one of our reliability engineers. We'll show you what ESA detects on assets like yours.